IUCN/SSC Otter Specialist Group Bulletin

|
©IUCN/SCC Otter Specialist Group Volume 31 Issue 1 (January 2014) Citation: Thompson, L, and Stelle, L.L. (2014). Prey Preference of the North American River Otter (Lontra canadensis) evaluated based on Optimal Foraging Theory. IUCN Otter Spec. Group Bull. 31 (1): 15 - 29 Prey Preference of the North American River Otter (Lontra canadensis) evaluated based on Optimal Foraging Theory Leslie Thompson1 and Lei Lani Stelle2
1Department of Biological Sciences, Rochester Institute of Technology, NY |


|
| Received 19th August 2013, accepted 5th December 2013 |
| Abstract: Prey preference of the North American river otter (Lontra canadensis) was studied in a captive population and evaluated according to optimal foraging theory. Live sunfish (Lepomis spp.), brown trout (Salmo trutta), and crayfish (Cambaridae spp.) were released in a pool, and the search, chase, and handling/eating times of two otters were recorded. When provided with choice of sizes, otters showed a significant preference for catching and eating large prey first. When given a choice of species, otters significantly preferred to catch and eat brown trout first; this preference remained when offered dead prey. Using the rate of energy intake, the preference for brown trout was expected as it provided significantly more energy per unit time, but size preferences only fit predictions after metabolic rate was incorporated, as an otter expends more energy chasing prey in the water than when eating on land. The net energy gained was significantly greatest for large prey in all the size trials and for brown trout in the species trials. Captive river otters exhibit prey preferences that match our predictions based on optimal foraging theory, which can provide insight into dietary habits of wild otter populations. |
| Keywords: aquatic mammal, energetics, otter diet, captive research |
| Française | Español |
INTRODUCTION
North American river otters (Lontra canadensis) inhabit a wide variety of habitats in freshwater (wetland, river, and lakes) and coastal marine environments ( IUCN Red List, 2013 ). They are adapted for hunting in the water ( Fish, 1994 ) and are often labelled as opportunistic predators since their preference depends on availability of prey. Fish are considered the primary source of food ( Hamilton, 1961 ; Melquist and Hornocker, 1983 ; Skyer, 2006 ); yet, crayfish are important prey when available ( Sheldon and Toll, 1964 ; Griess, 1987 ; Manning, 1990 ), which is usually during the summer months. Otters have also been known to eat reptiles, amphibians, birds, aquatic insects, small mammals, and molluscs ( Greer, 1955 ; Hamilton, 1961 ; Knudsen and Hale, 1968 ).
Prey speed and size are expected to influence predation by river otters. Most researchers have found that slow-moving fish were preferred over game fish ( Hamilton, 1961 ; Sheldon and Toll, 1964 ; Knudsen and Hale, 1968 ; Serfass et al., 1990 ; Cote et al., 2008 ), although some have found game fish such as trout, bass, and whitefish to be more important ( Greer, 1955 ; Melquist and Hornocker, 1983 ). One study of Eurasian otters (Lutra lutra) in captivity observed that the animals had difficulty catching prey that was smaller than 10 cm, attributing the preference for larger prey to their greater visibility to the otters ( Erlinge, 1968 ). However prey sizes in the diets of North American river otters in the wild ranges from 2 to 71 cm ( Melquist and Hornocker, 1983 ; Stearns and Serfass, 2011 ). Cote et al. (2008) found that minimum prey size varied with the species of fish, which may be due to differences in their camouflage and behaviour.
Optimality models are used to predict how an animal will behave based on the assumption that the trade-off between costs and benefits leads to the evolution of behaviors that provide the maximum gain to the organism ( Krebs and Davies, 1993 ). Optimal foraging theory can provide an explanation of prey preferences based on a diet that would maximize their caloric intake and minimize foraging energetic costs ( Emlen, 1966 ; MacArthur and Pianka, 1966 ; Alcock, 2001 ). Early models of optimal foraging theory by Emlen (1966) focused on the energetics of prey choice in relation to availability while MacArthur and Pianka (1966) incorporated the patchiness of prey distribution. A number of studies showed that optimal foraging theory applies to foraging behavior in aquatic mammals. Bowen et al. (2002) studied harbor seal (Phoca vitulina) foraging and found that the time spent chasing and handling prey, along with the associated energetic cost, differed significantly between prey items; the net energy gained increased with increasing prey size. Ford and Ellis (2006) showed that resident killer whales (Orcinus orca)selectively foraged for large, high fat content, and available year-round prey.
North American river otter populations had declined by the early 1900’s due to trapping, incidental mortality, loss of suitable habitat, and pollution ( Boyle, 2006 ). Fortunately, improvements in water quality and furbearer management techniques led to recolonization in many areas so that the species is now considered to be “Least Concern” ( IUCN Red List, 2013 ). There have also been numerous reintroductions throughout the United States to restore populations ( Raesly, 2001 ), but this raises concerns from fishermen that their game fish may be depleted by the otters ( Serfass et al., 1990 , Hoffman and Genoways, 2005 ).
The goal of this study was to learn the prey preference of the North American river otter and to assess if their preference follows the predictions of optimal foraging theory. We offered river otters a limited choice of sizes and prey species, predicting they would select the prey that provided the greatest caloric content per unit of foraging and handling time. By examining captive river otters, more can be understood about how these predators choose their prey and how availability of prey may impact their foraging behavior. This will allow managers to identify suitable habitat containing appropriate sizes and types of prey, which will help to protect both otter and fish populations.
ANIMALS, MATERIALS AND METHODS
Captive feeding experiments were conducted at the Seneca Park Zoo in Rochester, New York, USA from 26 June 2006 to 11 January 2007. Three river otters were part of the permanent collection: Darla (10 year old female), Nosey (16 year old male), and Admiral (17 year old male); Nosey was not used in the study as he is almost completely blind due to cataracts and unable to catch live prey. The otters were born in the wild (from Louisiana and South Dakota) and occasionally offered live fish at the zoo for enrichment, thus they had prior experience hunting and feeding on live prey. The exhibit includes an 11,670 gal oval pool which is 9.14 m long, 3.05 m wide at the north end and 1.83 m wide at the south end, ranging from 1.22 to 2.44 m deep. One small tube (~5 cm in diameter) was located at the lower right side of the pool and on occasion was used to deliver live feeding enrichments by the zoo staff. All trials were conducted between 0800 and 1000 hours before the zoo opened to the general public to avoid distractions from visitors. The otters’ morning meal of dead smelt, mackerel and capelin was withheld to ensure they would be hungry, but they were fed their regular meals of dry dog food and Natural Balance Zoo Carnivore Diet in the afternoon.
Prey options were based on the diet of local river otters ( Skyer, 2006 ) and were intended to provide a range of mobility and crypsis: slow-moving sunfish (Lepomis spp.), fast-moving brown trout (Salmo trutta), and camouflaged crayfish (Cambaridae spp.). Three experimental trials were conducted: size trials (n = 20: 6 trout, 7 sunfish, 7 crayfish), live species trials (n = 6), and dead species trials (n = 12). To determine if there is a preference for a prey size, one small, one medium, and one large live prey of the same species were released into the pool (size trials). To determine if there is a preference for a prey species, one of each of the prey types of the same size was released (live species trials). To determine if the species preference changed if the otter did not have to catch the prey, the dead species trials used the same three prey types, but they were thawed and lined up in a random order on the floor of their holding pens directly across from their access point, before the otters were allowed to enter. In all trials, only one otter was in the exhibit pool or in a holding pen at a time, and before the start of each live trial, prey were allowed a few minutes to acclimate to the pool.
Prey was obtained from suppliers or caught locally, and maintained in the lab for less than a month before experimental trials. Each prey item was weighed with an Acculab V-200 scale (0.01 g accuracy), measured with a meter stick, and then classified into three relative size groups ( Table 1 ). Lengths and masses of the three size classes were compared by ANOVA and differed significantly for each of the species (sunfish size trials -- length: F = 118.95, P<0.001, df = 2 and weight: F = 53.84, P<0.001, df = 2; crayfish size trials - length: F = 4.88, P = 0.018, df = 2 and weight: F = 10.68, P=0.001, df = 2; brown trout size trials -- length: F = 308.81, P<0.001, df = 2 and weight: F = 500.54, P<0.001, df = 2). For the species trials, medium fish and the largest available crayfish were used to try and offer the same sized prey but the crayfish were still significantly smaller in length than the brown trout and sunfish; there was also a significant difference between the masses of all three species with sunfish weighing the highest, trout were intermediate, and crayfish were the lowest weight (live species trials -- length: F = 19.90, P<0.001, df = 2, weight: F = 46.03, P<0.001, df = 2.; dead species trials -- length: F = 45.12, P<0.001, weight: F = 88.72, P<0.001, df = 2).
Trials were filmed with a digital camcorder (Canon Elura 90) from an underwater viewing area with a window 7.04 m wide by 2.16 m tall into the pool. Video records (11.4 hours) were later analyzed and the following variables measured: Search time (S) - start of a successful dive from the surface to when the otter saw a prey item, Chase time (C) - end of the search time until the otter firmly caught the prey by biting into it, Handling/eating time (F) – end of the chase time until the prey was consumed. Since medium sunfish and brown trout sizes used in both size and species trials were not significantly different, the time data for medium fish in size trials were combined with the respective time data from species trials to increase those data sets. Observations were recorded including which prey item was caught and eaten first, time spent in the water and on land, along with any other notable behaviors. Swim speed was calculated using a metric measuring tape placed parallel to the surface of the water along the glass window and the time it took for an otter to swim a measured distance was recorded.
To determine if the otters were feeding optimally, the rate of caloric intake (R) in Calories per second was calculated for each prey size and species in the different trials; R = E/H where E is the amount of energy (in Calories, e.g. Kcal) in a prey item and H is the time (in seconds) it takes to chase, handle, and eat the prey item ( Stephens and Krebs, 1986 ; Kruuk, 2006 ). The search time was not included as it was not comparable between trials due to the variation in prey location and otter positioning. Prey energy values were calculated by multiplying the average mass for each size class with energy content based on published literature: brown trout = 1.45 Cal g-1 ( Berg et al., 1998 ), sunfish = 0.89 Cal g-1, and crayfish = 0.72 Cal g-1 ( U.S. Department of Agriculture, 2006 ).
Estimates of metabolic costs while foraging were also incorporated. The energy cost in Calories of searching for, chasing, handling, and eating each prey item was calculated by:
Cost = [(MRW * (S+C)) + (MRW * F * %FW) + (MRL * F * %FL)] * Mass/ 4186.8 J/Cal
MRL (4.1 W kg-1) is the estimated metabolic rate of resting on land, and MRW (11.6 W kg-1) is the average rate while swimming for European river otters, Lutra lutra ( Pfeiffer and Culik, 1998 ). Although metabolic rates have not been studied in L. canadensis, Kruuk (2006) asserts they have a similar high metabolism as L. lutra. The average percent of handling and eating time spent in the water (%FW) and the average percent of handling and eating time spent on land (%FL) was measured from the video records. A value of 10 kg was used for mass as these otters ranged in weight from 9.05 kg to 10.1 kg throughout the study. Search time was included in this calculation since an otter could face similar variance of prey location in a stream as it would in our captive experiment pool and this value is an estimate of the true energetic costs of foraging. Net energy gained (in Cal) was calculated by subtracting the energy cost of capturing and consuming prey from the energy available in the prey.
Statistical analyses of the data were performed using Minitab 9 software (Minitab Inc, State College, Pennsylvania, USA) with α = 0.05. An Equal Variances test showed that not all variances were equal, so the time data was ranked and a General Linear Test was performed on the ranked data to determine if there was a significant difference between the time spent on foraging activities and energetics values with prey size or with species. We pooled multiple trials from each of the two otters so included otter identity as a factor to determine if there were individual differences, hereafter referred to as an otter effect. All significant differences were further examined with Tukey post-hoc comparisons. A One-Proportion test was used to assess if there was a preference in which prey was caught or eaten first.
RESULTS
Size trials
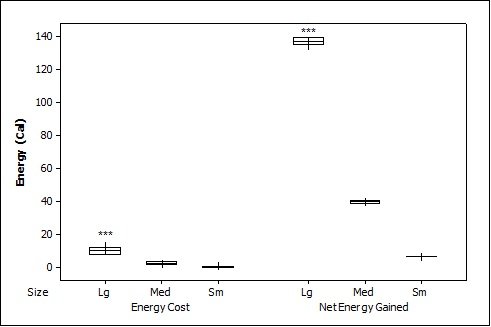
For brown trout, the time otters spent chasing, handling, and eating (H value; Table 2 ) was significantly different between all size classes(F = 38.62, P<0.001). Although the energy content increased significantly with each size class (F = 71.34, P<0.001) there was no significant difference in rates of caloric intake (R values) between sizes (F = 2.12, P=0.151). Large trout required a significantly greater energy cost to chase, handle, and consume (F = 49.35, P<0.001; Figure 1a ), but provided the greatest net energy gain (F = 49.35, P<0.001). There was a significant preference for large brown trout as the otters caught the large prey first in six out of seven trials (P=0.006; Fig. 2 ) and the large was always eaten first (P<0.001). In one trial, a medium trout was caught first and left on the bank, but then a large was caught and immediately consumed.
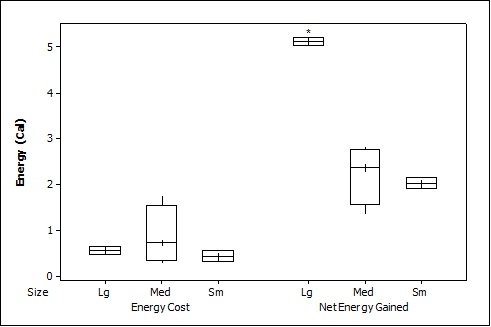
For crayfish, the time spent chasing, handling, and eating (H value) was significantly related to size ( Table 2 ) being higher for the large than the medium (F = 12.50, P=0.011) (small crayfish were not included in this analysis as four individuals were caught but only one was consumed so standard deviation could not be calculated). The large crayfish contained a significantly greater energy content than the small (F = 9.26, P=0.001). Although the large crayfish provide the highest rate of caloric intake (R value), it was marginally not significant (F = 5.35, P=0.057). There was no difference in the energy cost (F = 0.75, P=0.512), but the large crayfish provided a significantly greater net energy gain (F = 7.91, P=0.021; Figure 1b ). There was also no significant difference in which size they caught first (P=0.671; Fig. 2 ) as the large crayfish was caught first three out of six times. Yet, if the otter saw a large crayfish after catching a smaller size, it would drop it on land, then catch and consume the large one first before consuming the previously caught crayfish. Thus, there was a significant preference for the large crayfish as they ate the large ones first five out of six times (P=0.017).
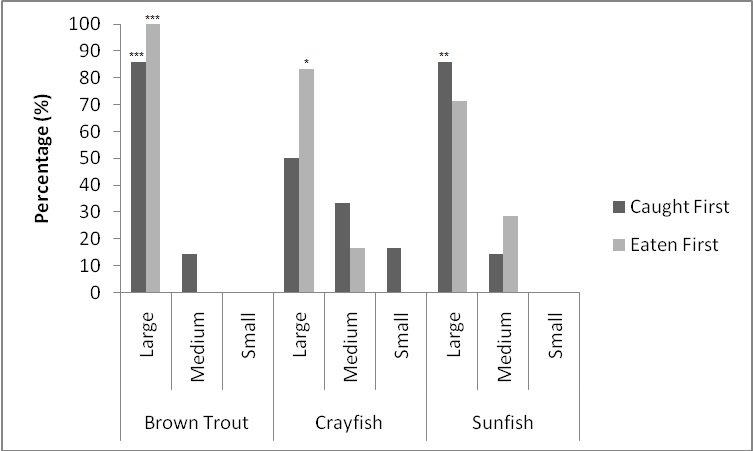
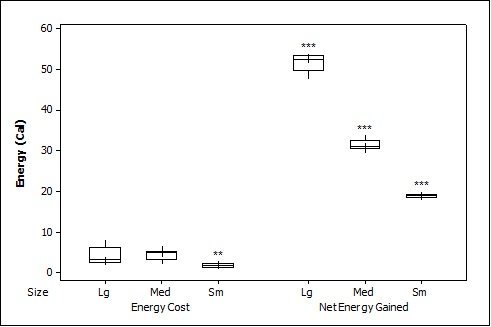
Small sunfish required significantly less time to chase, handle and eat (H value) (F = 5.93, P=0.011; Table 2 ), but there were no differences between the medium and the large sunfish (T = 0.487, P=0.878). The large sunfish contained significantly more prey energy, followed by medium and small (F = 53.81, P<0.001). The rate of caloric intake (R value) was significantly lower for the medium sunfish (F = 3.63, P=0.048). Small sunfish cost significantly less energy (P=0.003; Figure 1c ), but the large provided the greatest net energy gain, followed by the medium, and small (F = 56.21, P<0.001). The large sunfish were caught first six out of seven trials (P=0.006; Figure 2 ), but the large was only eaten first five out of seven trials since in one trial a large was caught and left on the bank, then a medium was caught and eaten before the large fish. Thus there was no significant difference in which size sunfish was eaten first (P=0.104).
Species trials
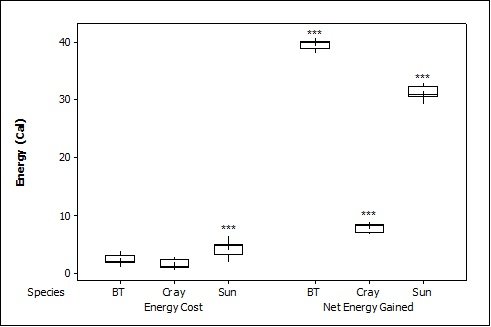
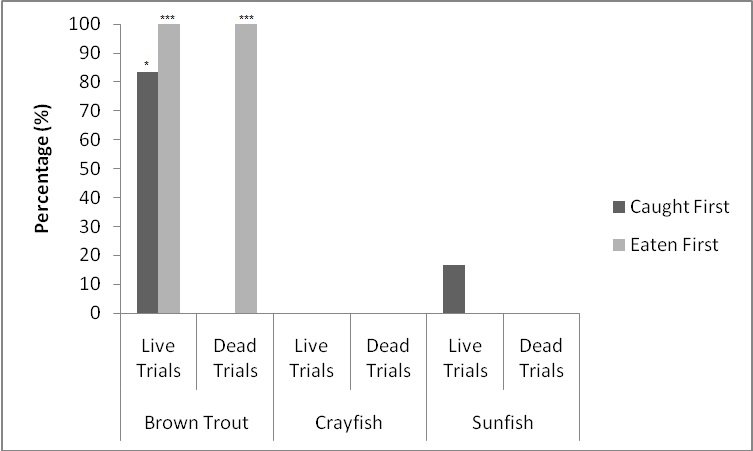
When all three prey types were offered together in the live species trials, otters spent significantly longest chasing, handling, eating sunfish (H value), followed by trout and then crayfish (F = 23.40, P<0.001; Table 2 ). Both brown trout and sunfish contained significantly more prey energy than the crayfish (F = 13.15, P<0.001). The rate of caloric intake (R value) was significantly larger for the brown trout than for the sunfish or the crayfish (F = 21.20, P<0.001). The sunfish had a significantly higher energy cost than the brown trout or crayfish (F = 12.72, P<0.001; Figure 3a ), and yielded less net energy than trout but more net energy than crayfish (F = 86.47, P<0.001). The otters displayed a significant preference for brown trout as they were caught first five out of six times (P=0.017; Figure 4 ) and were always eaten first (P=0.001), since in one trial, a sunfish was caught first, but was abandoned on the bank when the otter went back into the water to catch a brown trout and consumed it first.
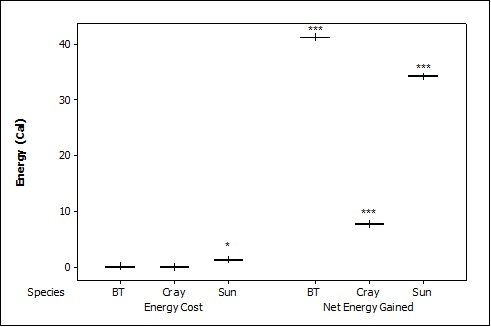
When otters were offered dead prey, it took them significantly longer to handle and eat the sunfish (F = 13.72, P=0.001; Table 2 ), but there was no significant difference between crayfish and brown trout (T=2.246; P=0.098). There was also a significant difference between individual otters in how long it took each to handle and consume the dead prey, e.g. an “otter effect” (F = 8.77, P=0.010). Both brown trout and sunfish contained significantly more prey energy than crayfish (F = 39.58, P<0.001). The brown trout provided the significantly largest rate of caloric intake (R value) (F = 17.40, P<0.001), and there was a significant otter effect (F = 40.32, P<0.001). The sunfish required a significantly larger energy cost (F = 6.16, P=0.011; Figure 3b ), while the brown trout provided a significantly greater net energy gain (F = 17.46, P<0.001). Both otters selected the brown trout first in all twelve dead trials (P<0.001, Figure 4 ). They differed though in their second choice; the sunfish were usually eaten next by Admiral while Darla instead chose the crayfish; resulting in a significant otter effect (F = 8.77, P=0.010).
Other trends
When chasing prey, otters’ average swim speed ( 0.94 ± 0.20 m/s) was significantly faster than their average cruising speed (0.49 ± 0.14 m/s) (n=16; F = 30.66, P<0.001). The otters also swam significantly faster when chasing brown trout (0.93 ± 0.15 m/s) compared to sunfish (0.86 ± 0.25 m/s) (n=8; F = 14.75, P<0.001). In 88% of the 38 prey captures otters consumed their prey on shore, and fish were always eaten tail first. The otters spent the least amount of time on land when handling and eating crayfish (40.9 ± 16.0% for crayfish; F = 9.84, P=0.002) but there was no significant difference between brown trout (63.3 ± 3.4%) and sunfish (72.2 ± 15.6%, F = 10.45, P=0.061).
Errors
In two brown trout and one sunfish size trials, the small prey hid in the small tube in the pool. The otters would check there when searching for prey but couldn’t reach them, and the prey never came out before the trials ended. In the crayfish size trials, Admiral was unable to locate the small crayfish in two out of three trials. Darla caught all of the crayfish, but she only ate one of the small entirely; the rest were either chewed until dead and left on the bank, or only partially consumed, so only the search and chase times could be used for these small crayfish. Therefore, the sample size was reduced for these trials.
DISCUSSION
Optimal foraging theory
The river otters displayed a clear preference for brown trout, which fits with the predictions from optimal foraging theory as trout provided significantly more Calories per unit time (R value). Otters also preferred large prey, catching and/or consuming large first for all three species, but this preference does not match our original prediction that energy rates would be maximized, as there was no significant difference in R values with size of crayfish or brown trout. We then decided to incorporate metabolic costs since the R value is calculated based only on total foraging time, but otter will expend more energy searching for and chasing prey in the water than when eating on land. For all prey species, the large individuals did provide significantly greater net energy gain compared to other prey sizes, which explains the otters’ preference since the cost of searching, chasing, handling and eating the large prey was outweighed by their greater caloric value. Another benefit of catching larger prey is that otters can spend more time on the bank consuming the prey instead of diving repeatedly for multiple small prey items, which provides a thermoregulatory advantage ( Kruuk, 2006 ).
Otters’ preference for the brown trout also optimizes metabolic benefit since although the trout did not contain significantly more calories than the sunfish, they required lower energetic costs to capture and consume, thus providing the largest net energy gain. The result is that salmonids (e.g. brown trout) were preferred over centrarchids (e.g. sunfish); this contradicts the assertion that otters hunt inversely proportional to prey’s swimming speed and ability to escape predation ( Erlinge, 1968 ; Serfass et al., 1990 ; Cote et al., 2008 ; Stearns and Serfass, 2011 ). Brown trout were observed to move faster and have more agility than the other prey, so the otters did have to swim faster while foraging for brown trout compared to sunfish. Yet, otters spent more time chasing, handling, and consuming (H value) sunfish, which may be partially due to this species having a larger girth at the same length, but is more likely a result of their spiny dorsal fins which were an obvious impediment to handling.
The preferences we observed in this captive study may not occur in the wild, due to a range of habitats and available prey species. Sunfish inhabit shallow and muddy waters; this provides river otters with a predatory advantage ( Tumilson and Karnes, 1987 ), so wild sunfish could be more beneficial than we considered here. Sunfish have been documented to be an important component of river otter diets in the wild ( Serfass et al., 1990 ; Skyer, 2006 ; Barding and Lacki, 2012 ). Otters have been shown to consume salmonids ( Greer, 1955 ; Melquist and Hornocker, 1983 ), but they may not be preyed upon when other warm water fish are available ( Sheldon and Toll, 1964 ) due to their greater speed. Nonetheless, the importance of trout may be underestimated as many diet studies rely on scat analysis and trout may be difficult to distinguish because of its small scales ( Hamilton, 1961 ). Crayfish are important seasonal prey in the wild as they are abundant in the summer months ( Noordhuis, 2002 ; Skyer, 2006 ; Roberts et al., 2008 ) and many can be consumed in a relatively short period of time with little energetic cost to the otter. Although otters would need to consume more than four crayfish to equal the amount of energy gained from a single brown trout of the same length, Emlen (1966) predicted that an animal may eat a less rich or efficient prey choice if it is highly abundant.
Other studies have applied optimal foraging theory to explain prey preference in aquatic mammals. Bowen et al.(2002) studied foraging tactics of male harbor seals and found differences between cryptic prey. Seals ate sand lances (Ammodytes dubius) faster than flounder (Pleuronectids) although they required longer search time, and small to medium sand lances were more profitable than the same sized flounder. However, flounder were more profitable at larger sizes. These results were similar to our observations: otters invested less time eating crayfish compared to sunfish but sunfish were still more profitable than crayfish. Bowen et al. (2002) also found that profitability (kJ min-1) increased with prey size for all consumed species. In our study, profitability did not increase with prey size until we accounted for the otters’ metabolic requirements, but then there was a greater net energy gain with the large prey of all types. Ford and Ellis (2006) examined prey preference in fish-eating killer whales. Their primary prey was the Chinook salmon (Oncorhynchus tshawytscha)which is found year-round in the study area, although their numbers fluctuate. When other salmon were more abundant than the Chinook, the killer whales still preferred it because of its large size and high lipid content. Similarly, high energy content of the brown trout made it a preferred prey of otters in our study. In the Ford and Ellis (2006) study, rockfish (Sebastes spp) were also abundant but were thought to be avoided because of the dorsal spines, which is comparable to the otters’ avoidance of sunfish when brown trout were available.
Observations
All prey types employed both active and passive defence strategies. The sunfish and crayfish were camouflaged against the sandy-coloured bottom of the pool and the small individuals of all prey types were able to hide in crevices. It was especially difficult for the otters to find the cryptic crayfish and a number entirely escaped detection. This supports Erlinge’s (1968) observation that otters utilize sight to track prey, although they can also rely on their vibrissae to detect vibrations of their prey (Green, 1977) . The crayfish also actively tried to protect themselves by pinching the otters instead of trying to escape by swimming, yet the otters were able to avoid this defence mechanism by grabbing the crayfish behind the claws. The otters could eat the smaller crayfish while swimming, but took the larger ones to the shallows and crushed them against the rocks. The fish also put up a struggle when caught, and they were eaten tail-first in every trial. Erlinge (1968) stated that the otters ate fish head-first in order to kill them faster. However, eating fish tail-first also has its advantages, as we observed that the otters would maim the fish during the handling time which reduced the ability of the fish to struggle and interfere with consumption. They nearly always ate their prey on land which disagrees with Kruuk et al. (1987) who found that most fish are eaten in the water and only large prey are taken to the shore. Since the otters landed most of the prey, it would be easier to hold the fish by the sturdier head than the flimsy tail. Also, if the heads were too large to swallow whole or too hard to eat through the bones, the otter would discard the head, which it wouldn’t be able to do if it tried to eat its prey head-first.
In the dead trials, both otters always ate the brown trout, but they did not always eat the sunfish or crayfish. It’s been documented that otters may not want to eat dead prey if they did not kill it themselves ( Erlinge, 1968 ). Darla refused the thawed sunfish while Admiral avoided the thawed crayfish. Eating sunfish provides a significantly larger energy gain than crayfish, so from an optimal feeding standpoint, Darla’s behavior does not match predictions. It could be that otters have a personal preference which may reflect differences in the taste of dead prey.
Potential limitations
As this was a captive study, caution must be exercised before extrapolating our results to the wild. In this study, the pool didn’t offer prey the same protection available in a lake or a creek, which could alter measured search and chase times. The few hiding places in the pool did create a problem though as small fish sometimes swam into a tube where the otters couldn’t catch them. About half the time, the fish swam back out, but when they remained in the tube until the trials were over, it reduced the sample size for small prey. Although this did not appear to effect the results since otters only selected small fish after larger ones, in the future this could be resolved by closing access to the tube with a mesh cover. In addition, all three prey types require different conditions in terms of water temperature and dissolved oxygen, and may not all be found in the same area at once in the wild so otters may not have the option of selecting between these choices. The significant difference between the lengths of the different prey species in the species trials (due to the smaller size of crayfish) should not have affected the conclusions as all prey types were similar in length, and energy comparisons factored the differences in weight into account. It is possible that the otters’ prior experience with large trout from the size trials could have biased them to selecting prey that they knew could be larger. There is always the concern of individual variation since we only studied two otters, but they both exhibited the same preferences for both the size and live species trials with a significant otter effect only in the dead trials. Although the small sample size should be taken into account when extrapolating the results from this study to make general predictions, Cote et al. (2008) found that otters in a coastal marine environment selected less mobile and larger prey.
Conservation
Captive studies provide an opportunity to examine prey preferences in a controlled setting with the ability to observe underwater foraging behaviors impossible to view in the wild. Emlen (1966) originally predicted and more recent studies (e.g. Cote et al., 2008 ) have confirmed that animals should be more selective when food is not limited, thus the captive setting allowed us to observe what prey otters ideally prefer and is most energetically beneficial. Otters can consume 12% of their body weight in prey per day ( Kruuk, 2006 ), so it is essential that suitable habitats with abundant and beneficial prey is conserved. Fish were shown to provide otters with a higher net energy gain, but crayfish are also important as they can be caught and eaten quickly when abundant. There should be little concern that otters will deplete game fish as the otters may not be able to catch them in the wild and other studies have concluded that otters do not destroy game fish ( Knudsen and Hale, 1968 ; Serfass et al., 1990 ). Optimal foraging theory can be useful in predicting areas where wild otter populations may be successful due to foraging opportunities and identifying habitat suitable for reintroduction efforts.
Conclusions
As main conclusions we can state that:
- River otters preferred the largest prey when provided with a choice of three different sizes of a single species.
- When offered a variety of prey species, river otters preferred brown trout over similarly sized sunfish and crayfish, regardless of whether prey was alive or dead.
- Preferences for size and species of prey matched predictions based on optimal foraging theory, as prey selection maximized net energy gained after accounting for the metabolic costs of foraging.
- Controlled studies of captive animals can help predict optimal habitat for wild river otter populations.
Acknowledgements - L. Thompson was funded by the Rochester Institute of Technology College of Science Summer Undergraduate Research Program. Support was also provided to L. Stelle by the Rochester Institute of Technology College of Science Faculty Development Fund. We would like to thank Dr. David Mathiason for his statistical advice, Barbara McElwee for her assistance, and the Research Scholars Program for its support. We greatly appreciate the assistance and support provided by Seneca Park Zoo, and would like to thank Willow Pond Aqua Farms, Caledonia Fish Hatchery, and George’s Bait Farm for supplying the prey. This manuscript was improved by constructive critique from two anonymous reviewers.n
REFERENCES
Alcock J. (2001). Animal Behavior. 7th Ed. Sinauer Associates, Inc., Massachusetts.
Barding, E.E., Lacki, M.J. (2012). Winter diet of river otters in Kentucky. Northeastern Naturalist
19(2): 157-164.
Berg O.K, Thronaes E, Bremset G. (1998). Energetics and survival of virgin and repeat spawning brown trout (Salmo trutta). Canadian Journal of Fisheries and Aquatic Sciences
55: 47-53.
Bowen W.D, Tully D, Boness D.J, Bulheier B.M, Marshall G.J. (2002). Prey-dependent foraging tactics and prey profitability in a marine mammal. Marine Ecology Progress Series
244: 235-245.
Boyle, S. (2006). North American River Otter (Lontra canadensis): a technical conservation assessment. USDA Forest Service, Rocky Mountain Region.
[Available from : http://www.fs.fed.us/r2/projects/scp/ assessments/northamericanriverotter.pdf accessed 18th March 2014].
Cote D., Stewart H. M. J., Gregory R. S., Gosse J., Reynolds J. J., Stenson G. B., Miller E.H. (2008). Prey Selection by Marine-coastal River Otters (Lontra canadensis) in Newfoundland, Canada. Journal of Mammalogy: 89 (4): 1001-1011.
Emlen J.M. (1966). The role of time and energy in food preference. The American Naturalist
100: 611-617.
Erlinge S. (1968). Food studies on captive otters Lutra lutra L. Oikos 19: 259-270.
Fish F.E. (1994). Association of propulsive swimming mode and behavior in river otters (Lutra canadensis). Journal of Mammalogy
75: 989-997.
Ford J.K.B, Ellis G.M. (2006). Selective foraging by fish-eating killer whales Orcinus orca in British Columbia. Marine Ecology Progress Series
316: 185-199.
Green, J. (1977). Sensory perception in hunting otters, Lutra lutra L. J. Otter Trust
1977, 13-16.
Greer K.R. (1955). Yearly food habits of the river otter in the Thompson Lakes Region, Northwestern Montana, as indicated by scat analyses. American Midland Naturalist
54: 299-313.
Griess, J.M. (1987). River otter reintroduction in Great Smokey Mountains National Park. Masters Thesis University of Tennessee, Knoxville, 109 pp.
Hamilton W.J.J. (1961). Late fall, winter, and early spring foods of 141 otters from New York. New York Fish and Game Journal
8: 106-109.
Hoffman, J.D., Genoways, H.H. (2005). Recent records of formerly extirpated carnivores in Nebraska. The Prairie Naturalist
37(4): 225-244.
IUCN (2013). IUCN Red List of Threatened Species. Version 2013.2.
[Available from
www.iucnredlist.org
accessed 9 November 2013]
Knudsen G.J, Hale J.B. (1968). Food habits of otters in the Great Lakes region. Journal of Wildlife Management
32: 89-93.
Krebs J.R, Davies N.B. (1993). An introduction to behavioral ecology. 3rd Ed. Blackwell Sciences, Oxford.
Kruuk H. (2006). Otters: ecology, behaviour and conservation. Oxford University Press, New York.
Kruuk H., Conroy J.W.H., Moorehouse A. (1987). Seasonal reproduction, mortality and food of otters Lutra lutra L. in Shetland. Symposia of the Zoological Society of London
58:263-278.
MacArthur R.H, Pianka E.R. (1966). On optimal use of a patchy environment.
The American Naturalist
100: 603-609.
Manning T. (1990). Summer feeding habits of River Otter (Lutra canadensis) on the Mendocino National Forest, California. Northwestern Naturalist
71: 38-42.
Melquist W.E., Hornocker M.G. (1983). Ecology of river otters in west central Idaho. Wildlife Monographs
83: 1-60.
Noordhuis, R. (2002). The river otter (Lontra canadensis) in Clarcke County (Georgia, USA)–survey, food habits and environmental factors. IUCN Otter Spec. Group Bull, 19(2): 75-86.
Pfeiffer P., Culik B.M. (1998). Energy metabolism of underwater swimming in river otters (Lutra lutra L.). Journal of Comparative Physiology B: Biochemical, Systemic, and Environmental Physiology
168: 143-148.
Raesly E.J. (2001). Progress and status of river otter reintroduction projects in the United States.
Wildlife Society Bulletin
29: 33, 856-862.
Roberts, N. M., Rabeni, C. F., Stanovick, J. S., & Hamilton, D. A. (2008). River otter, Lontra canadensis, food habits in the Missouri Ozarks. The Canadian Field-Naturalist, 122(4): 303-311.
Serfass T.L, Rymon L.M, Brooks R.P. (1990). Feeding relationships of river otters in Northeastern Pennsylvania. Transactions of the Northeast Section of the Wildlife Society
47: 43-53.
Sheldon W.G, Toll W.G. (1964). Feeding habits of the river otter in a reservoir in central Massachusetts. Journal of Mammology
45: 449-455.
Skyer M. (2006). Food Habits of a Re-Introduced River Otter (Lontra canadensis) Population in Western New York- Annual Diet and Temporal Variation in Diet. M.S. thesis, Rochester Institute of Technology, New York.
Stearns, C.R, Serfass L. (2011). Food habits and fish prey size selection of a newly colonizing population of river otters (Lontra canadensis) in eastern North Dakota. American Midland Naturalist
165: 169-182.
Stephens, D.W, Krebs, J.R. (1986). Foraging Theory: Monographs in Behavior and Ecology. Princeton University Press, New Jersey.
Tumilson R., Karnes M. (1987). Seasonal Changes in Food Habits of River Otters in
Southwestern Arkansas Beaver Swamps. Mammalia
51: 225-231.
U.S. Department of Agriculture (2006).
USDA national nutrient database for standard reference, release 19
[Available form.
http://ndb.nal.usda.gov/
accessed 18th March 2014]
Résumé : Préférences Alimentaires de la Loutre du Canada Évaluées selon la Théorie de l’« Optimal Foraging » (Prédation Optimale).
Les préférences alimentaires de la loutre du Canada (Lontra canadensis) ont été étudiées dans une population captive et évaluées selon la théorie de l’ « optimal foraging ». Des perches-soleil (Lepomis spp.), des truites de rivière (Salmo trutta) et des écrevisses (Cambaridae spp.), ont été lâchées vivantes dans un bassin et les temps de recherche, de chasse et de consommations de ces proies par deux loutres ont été enregistrés. Quand elles ont le choix de la taille, les loutres montrent une nette préférence pour la capture et la consommation de grandes proies. Quand elles ont le choix de l’espèce, les loutres montrent une nette préférence pour les truites. Cette préférence demeure si la proie est morte. On pouvait s’attendre à une préférence pour la truite du fait du meilleur rendement énergétique apporté par unité de temps, mais le choix de la taille de la prise ne peut s’expliquer qu’en faisant intervenir le taux métabolique car les loutres dépensent plus d’énergie à chasser une proie dans l’eau qu’à la manger sur terre. Le bilan énergétique est plus favorable pour les grosses prises dans tous les essais sur la taille et pour la truite dans les essais sur les espèces de proies. Les loutres captives montrent des préférences prédictibles si on se fonde sur la théorie de l’ « optimal foraging », ce qui donne des indices sur les habitudes alimentaires des populations de loutres sauvages.
Revenez au dessus
Resumen: Preferencia de Presas de la Nutria Norteamericana (Lontra canadensis) evaluada en Base a la Teoría del Forrajeo Óptimo
Se estudió la preferencia de presas de la nutria norteamericana (Lontra canadensis) en una población en cautiverio, y se la evaluó de acuerdo a la teoría del forrajeo óptimo. Se liberaron individuos vivos de perca-sol (Lepomis spp.), trucha marrón (Salmo trutta), y cangrejos de río (Cambaridae spp.) en una pileta, y se registraron los tiempos de búsqueda, persecución, y manipulación/ingesta, de dos nutrias. Cuando se les proporcionaban opciones de tamaños, las nutrias mostraron una preferencia significativa por capturar y comer primero las presas grandes. Cuando se les proporcionaban opciones de especies, las nutrias prefirieron significativamente capturar y comer primero a las truchas marrones; esta preferencia persistió cuando se ofrecieron presas muertas. Usando la tasa de ingesta de energía, era esperable la preferencia por la trucha marrón, al proporcionar significativamente más energía por unidad de tiempo, pero las preferencias de tamaño sólo encajan con las predicciones después de se incorporó la tasa metabólica, ya que una nutria gasta más energía para capturar la presa en el agua que para comerla en tierra. La energía neta ganada fue significativamente mayor para las presas grandes en todas los tests de tamaño y para la trucha marrón en los tests de especies. Las nutrias en cautiverio exhiben preferencias de presas que encajan con las predicciones basadas en la teoría del forrajeo óptimo, lo que puede ayudar a la comprensión de los hábitos dietarios de las poblaciones silvestres de nutrias.
Vuelva a la tapa