IUCN/SSC Otter Specialist Group Bulletin

|
©IUCN/SCC Otter Specialist Group Citation: Marnell, F., O'Neill, L. and Lynn, D. (2011) How To Calculate Range And Population Size For The Otter? The Irish Approach As A Case Study. Proceedings of XIth International Otter Colloquium, IUCN Otter Spec. Group Bull. 28B: 15 - 22 How To Calculate Range And Population Size For The Otter? The Irish Approach As A Case Study Ferdia Marnell1, Lughaidh Ó Néill2 and Dierdre Lynn1
1National Parks and Wildlife Service, Department of Arts, Heritage and the Gaeltacht, 7 Ely Place, Dublin 2, Ireland. Email: Ferdia.Marnell@ahg.gov.ie |


 |
| (Received 2nd November 2011, accepted 8th January 2012) |
| Abstract: All EU Member States are obliged to submit reports to the EU Commission every 6 years, detailing the conservation status of species and habitats listed on the Habitats Directive. The otter (Lutra lutra) is one such species. Despite a number of national surveys that showed that the otter was widespread across the country, in Ireland’s 2007 conservation status assessment the otter was considered to be in unfavourable condition. While the Range, Habitat and Future Prospects categories were all considered favourable, Population was deemed to be unfavourable. This paper examines the data behind the 2007 assessment by Ireland, which included three national otter surveys and a series of radio-tracking studies. Range was mapped and calculated based on the results of national distribution surveys together with records submitted from the public. Population size was estimated by calculating the extent of available habitats (rivers, lakes and coasts), dividing that by the typical home range size and then multiplying the result by the proportion of positive sites in the most recent national survey. While the Range of the otter in Ireland did not decrease between the 1980/81 and the 2004/05 surveys, Population trend was calculated as -23.7%. As a consequence, the most recent national Red Data List for Ireland lists the species as Near Threatened (Marnell et al., 2009). |
| Keywords: Population estimates; conservation status; Habitats Directive reporting; national survey; Lutra lutra |
| Française | Español |
INTRODUCTION
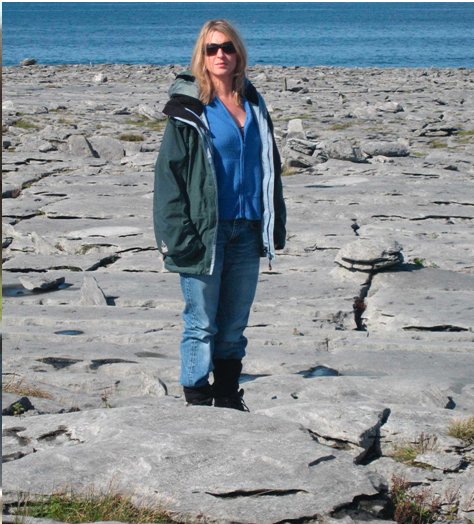
The Eurasian otter (Lutra lutra) occurs throughout Ireland along rivers, lakes and coasts and, compared to most other countries in Europe, Ireland continues to support a large and healthy otter population (Chapman and Chapman, 1981; Lunnon and Reynolds, 1991; Bailey and Rochford, 2006).
Three national distribution surveys of otters have been conducted in Ireland, based on the standard field methodology whereby up to 600m of river bank / coastline are surveyed for signs. (e.g. Lenton et al., 1980). The first survey, based on a random stratified sample of 2,042 sites, found signs of otters throughout the country, at 88% of sites surveyed (Chapman and Chapman, 1982). A smaller follow-up survey of 246 of the original sites was carried out a decade later (Lunnon and Reynolds, 1991). Initial results suggested that otters had not declined. However, when a further survey was completed in 2004/05 (Bailey and Rochford, 2006) a significant decline of almost 24% had occurred. Detailed examination of original survey cards from the 1991 survey showed that this decline had largely happened in the 1980s but had been overlooked due to over-surveying (i.e. repeat surveys at negative sites, extended surveys beyond 600m see Bailey and Rochford, 2006 for details).
In Ireland’s 2007 conservation status assessment (under Article 17 of the EU Habitats Directive), the otter was considered to be in unfavourable (inadequate) condition (NPWS, 2007). This assessment incorporates elements on Range, Habitat, Future Prospects and Population, and while the first three categories were all considered to be in favourable condition, Population was judged to be “unfavourable (inadequate)”.
The EU Commission have produced guidelines for the assessment of data for the Article 17 reports (Evans and Arvela, 2011), however there is still considerable variation between countries in how the data is manipulated and how the assessments are completed. This makes inter-country comparisons and Europe-wide summaries difficult. This paper presents the background to Ireland’s 2007 assessment of otter Range and Population in an effort to facilitate discussion between country agencies in advance of the next Article 17 reports due in 2013.
METHODS
Range
The EU Commission definition of range is “the spatial limits in which a species is found” and this is calculated by drawing an envelope around the known distribution points for the species: “Technically the range will be calculated by filling in unoccupied grids between cells of distribution” (Evans and Arvela, 2011).
The recommended approach for Article 17 reporting is to prepare and report on these data at the 10km level. For wide ranging species such as the otter, the EU guidelines recommend closing gaps between known distribution points of 40 – 90 km depending on the species. “A gap distance should be understood as the distance between two distribution grids, that will not be joined together to form a single polygon, component of range…… The gap distance should reflect the ecological characteristic of the habitat types and species. This means that for mobile species the range will be calculated using larger gaps and conversely smaller gaps will be used for more sedentary species. The Guidelines go on to recommend a gap distance of 40-90 km for terrestrial mammals, depending on dispersal ability........ …. but other gap distances can be used if based on detailed knowledge of the species within the Member State” (Evans and Arvela, 2011).
As Ireland is a relatively small country and we have good distribution data for otter we used a more conservative cut-off of 20 km for gap closure. In other words, gaps between known distribution points of up to 20 km are included in the range, but gaps of > 20km would lead to a hole appearing within, or at the edge of, the range map.
Otter records on the NPWS database from 2000-2007 were used to produce the range map. The majority of these distribution records come from the survey of 2004/05 (Bailey and Rochford, 2006); additional records come from the authors’ own field work, other NPWS staff and the public (Figure 1).
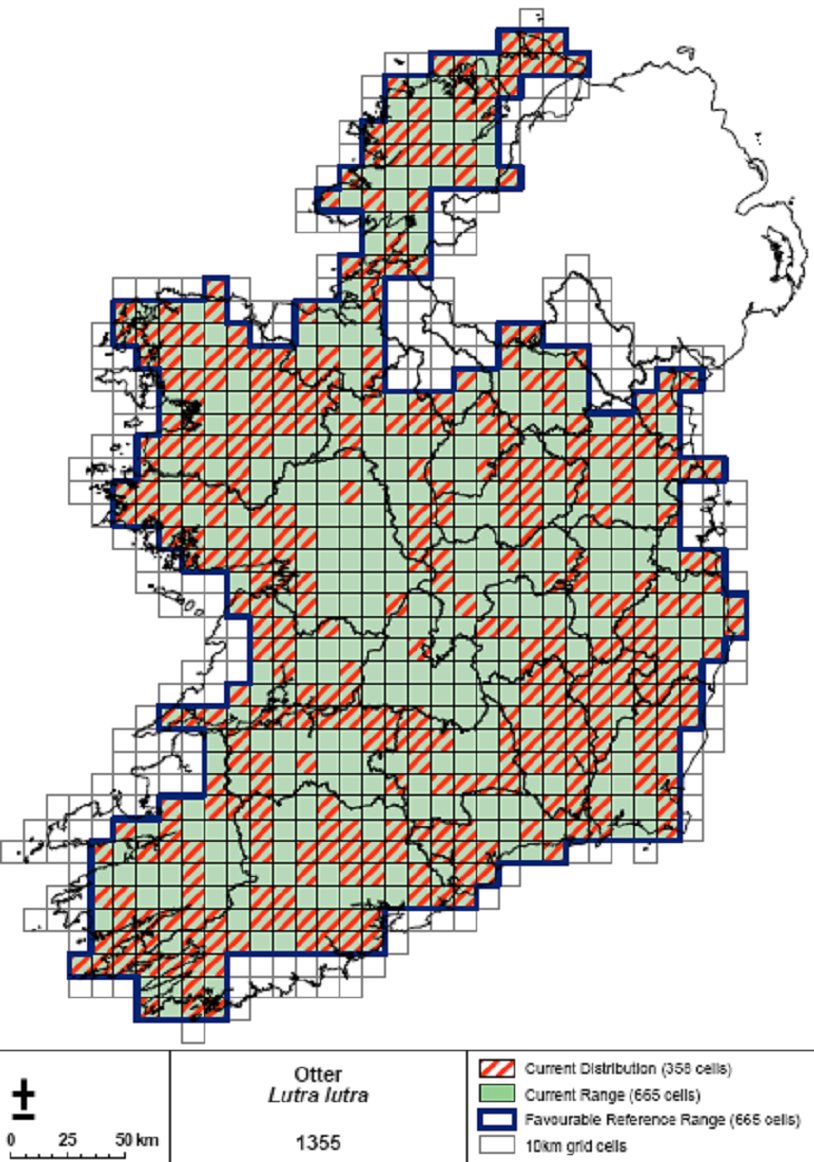 |
| Figure 1.Map of Ireland showing otter range and distribution Click for larger image |
Population
The estimation of population size was based on a simple formula wherein the extent of available habitat was divided by typical female home range size. Females were used because they are known to maintain more stable home ranges than males (Kruuk, 1995, 2006). This figure - in effect the potential total number of female home ranges - was then multiplied by the proportion of positive sites in the most recent national survey.
| Extent of habitat | 1 | ||||
| Total adult population | = | x ( | +ve sites) x 2 | ||
| average female territory size | % |
Extent of habitat was estimated on the basis of four classes of water bodies: rivers, streams, lakes and coast (OSi, 2005). Ó Néill (2008) has used the ground-truth data gathered by Chapman & Chapman (1982) and Bailey and Rochford (2006) to calculate the average width of river features (12.9 m; n = 893), and the average width of stream features (4.2 m; n = 955). In addition, a 10 m riparian buffer (both banks) was considered to comprise part of the otter habitat along watercourses. The width of lake and coast habitat was estimated to be an 80 m strip of water (reflecting the fact that otters seldom forage beyond this distance - Kruuk et al., 1998) plus a 10 m terrestrial buffer.
Ó Néill (2008) has also calculated the total habitat lengths for each category based on simple manipulations of the available Ordnance Survey data in Ireland (OSi, 2005) (Table 1).
Average females’ home ranges were derived from a combination of the following:
- Radio-tracking data for seven adult females in mesotrophic Irish rivers (>0.04 mg/l orthophosphate). These data showed that females occupied exclusive home-ranges averaging 7.5 ± 1.5 km that were inversely related to river width (Ó Néill et al., 2009).
- Observations of ten female otters on oligotrophic rivers (<0.02mg/l orthophosphate) in Scotland showed no relationship between home-ranges and river width, with home-ranges averaging 18.7 ± 3.5km (Kruuk, 2006).
- Observations of 10 coastal otters on Shetland found that adult females occupied group ranges at densities of 2.6 ± 0.9 km/individual (Kruuk and Moorhouse, 1991).
To account for the lack of data for watercourses with orthophosphate levels between 0.02 and 0.04mg/l, we followed Ó Néill’s (2008) approach and took the fitted line as the average intercept and slopes for more and less productive rivers. Note that the otters living in the oligotrophic rivers showed no relationship with river width so they had a slope of 0 and an intercept of 18.6. For mesotrophic and oligotrophic rivers confidence intervals for linear regression were calculated for home range lengths of Scottish and Irish otters with river width. For these categories the upper and lower values for home range length were used to calculate the lower and upper values for otter numbers. For intermediate rivers we assumed the best estimate of otter home range length as the average of the mesotrophic and oligotrophic values. The upper confidence interval for population for these intermediate waters was based on the lower confidence for mesotrophic home range length and the lower confidence interval for population for these intermediate waters was based on the upper confidence for oligotrophic home range length. For coastal otters, confidence intervals were calculated based on published averages and standard deviations or where these were unavailable, derived from the published raw data (op. cit.).
Based on interpolation of the point data for known orthophosphate levels (McGarrigle et al., 2010), each section of river within the contours of a particular orthophosphate level was assigned that orthophosphate value. The length of each water course type (oligotrophic river, meso-oligotrophic river, mesotrophic river, oligotrophic stream etc.) within each river basin district was converted into a number of otters by dividing it by the spatial requirements of female otters in that habitat.
The total number of potential female territories was then multiplied by the proportion of positive records in the most recent national survey (i.e. as proxy for the number of occupied territories) to give an estimate of female otter population. The same calculations were also made for previous national surveys thereby allowing an estimate of population trend over time to be derived.
RESULTS
Range
The otter’s range was based on distribution records from 358 individual 10 km squares. No major discontinuities within the range were identified, but gaps around the periphery are apparent (Figure 1). The total range was calculated as 665 10 km squares, i.e. 66,500 km². This is equivalent to 75 % of the land mass of Ireland.
Despite the decline in occurrence from 88 % of sites surveyed in 1980/81 to 70% in 2005, the otter remains widespread throughout the country with no apparent reduction in range when compared to the results of previous national survey. Although the current range is considered to be favourable, this is still thought to be an underestimate of the actual range as coastal sites have been overlooked to some extent in national surveys to date (Figure 1).
Population
The otter population in Ireland is estimated to be in the region of 6,416 female animals (not including juveniles), with an upper confidence level of 9,724 and a lower confidence level of 4,537. Using the same formula on the data from previous surveys suggests that otter numbers have fallen since the early 1980s by approximately 2,000 females, or, assuming a 1:1 male to female ratio (Kruuk, 1995), a total of 4,000 adults, (Table 2).
DISCUSSION
The otter has suffered some declines in Ireland over the past 30 years. However, compared to most other European countries, the species remains widespread and there is still a healthy population across the country. This current range covers 75 % of the total area of Ireland (c. 875 10 km squares). A less conservative gap closure of 40 km would have added a further 39 10 km squares around the periphery of the range - an increase of 6 %.
For the purposes of calculating trends, the EU guidelines argue that “A range calculated with larger gap distances (40–50 km) is more sensitive to changes at the margins of the distribution and large scale changes within the outer limit of the distribution. On the other hand range calculated with smaller gap distances (20 km) is sensitive to small scale changes (Evans and Arvela, 2011).
We anticipate that better data will be responsible for the apparent changes in range in the next conservation assessment. Much of the Irish coast, particularly in the south and along the western seaboard, contains habitat suitable for the otter (Marnell pers ob.). However, previous national surveys have under-represented this element of its distribution and consequently the range map shows the species to be absent from much of the Irish coastline. A 4th national survey is underway in Ireland and coastal sites are being specifically targeted to provide a more comprehensive understanding of otter distribution here. The next Article 17 report will include this data and consequently the figure for the otter’s range is likely to increase - not of course indicating any increase in the otter’s range, but reflecting a better understanding of its actual distribution.
While the otter’s range may actually increase, there is no reason to believe that the population estimate will increase. There was some flexibility in how population estimates could be presented in the 2007 assessment (e.g. countries could use the number of occupied 10 km squares instead of actual numbers). However, for the 2013 report, the EU Commission requires population estimates to be provided as “number of adults”. There are many difficulties with providing accurate population figures and several different approaches have been used with varying degrees of success over the years. These have included estimations based on, for example, the number of occupied holts (e.g. Kruuk et al., 1989), snow tracks (e.g. Sidorovich and Lauzhel, 1992; Sulkava, 2007), infra-red cameras (Garcia et al., 2006) and extrapolations from genetic fingerprinting (Prigioni et al., 2006). The method we have used requires detailed information on habitat availability to underpin the calculations. An understanding of home range size is also necessary. For the 2007 report, Ireland used home range size data for coastal otters reported from Scotland (Kruuk and Moorhouse, 1991). In 2010, GSM tracking studies of coastal otters were carried out in Ireland and the data from this work (Quaglietta et al., 2012) will improve our calculations of otter population in Ireland for the next conservation assessment in 2013. Further work on home range sizes in oligotrophic rivers and lakes in Ireland would also be useful. Calculations can also be further refined by using more detailed information on trophic status (and therefore carrying capacity) of freshwaters and coastal waters. Developing population trends for individual river basins also allows more detailed investigation of localized declines/increases which may be masked by the national picture (Ó Néill, 2008).
Home range size extrapolations could also be improved if comprehensive fish biomass data was available nationally. Fish biomass assessments in Ireland have traditionally focused on salmonid populations. However, in more recent years, a more comprehensive sampling programme has been initiated to comply with requirements under the Water Framework Directive (IFI, 2011). It is hoped that in time this data can be integrated into the conservation assessment for the otter. Despite these shortcomings the method we have used provides a fairly reliable estimate of population size (with confidence intervals) and providing national distribution surveys are conducted at regular intervals and using comparable methods, the calculation of trend is robust (Reid et al., in prep).
REFERENCES
Bailey, M., Rochford, J. (2006). Otter Survey of Ireland 2004/2005. Irish Wildlife Manuals No. 23. National Parks and Wildlife Service, Department of Environment, Heritage and Local Government, Dublin, Ireland.
Chapman, P. J., Chapman, L.L. (1982). Otter survey of Ireland. Vincent Wildlife Trust.
Conroy, J.W.H., Chanin P. (2001). The distribution and status of the European otter (Lutra lutra) - A review. In: Conroy J.W.H., Gutleb, A., Yoxon, P. (eds.), Proc. Otter Toxicol. Conference, Skye 2000, International Otter Survival Fund, Broadford, Skye, pp. 7-28.
Council of Europe (1979). Convention on the Conservation of European Wildlife and Natural Habitats. CETS 104. Bern, Switzerland.
Evans. D., Arvela, M. (2011). Assessment and reporting under the Habitats Directive. European Topic Centre on Biological Diversity. Paris, France.
Garcia de Leaniz, C., Forman, D.W., Davies, S., Thomson, A. (2006). Non-intrusive monitoring of otters (Lutra lutra) using infrared technology. Journal of Zoology 270: 577-584.
IFI (2011). Sampling fish for the Water Framework Directive. Summary Report 2010. Inland Fisheries Ireland, Dublin.
Jongh, A. de, O’Neill, L., Marnell, F., de Jong, T. (in prep). GPS/GSM tracking of coastal otters in Roaringwater Bay, West Cork, Ireland.
Kruuk, H. (1995). Wild Otters - predation and populations. Oxford University Press, Oxford.
Kruuk, H. (2006). Otters – ecology, behaviour and conservation. Oxford University Press, Oxford.
Kruuk, H., Carss, D.N., Conroy, J.W.H., Gaywood, M. J. (1998). Habitat use and conservation of otters (Lutra lutra) in Britain. Symposia of the Zoological Society of London 71, 119-133. Cambridge University Press.
Kruuk, H., Moorhouse, A. (1991). The spatial organization of otters (Lutra lutra) in Shetland. Journal of Zoology, London 224: 41-57.
Kruuk, H., Moorhouse, A., Conroy, J.W.H., Durbin, L., Frears, S. (1989). An estimate of numbers and habitat preferences of otters Lutra lutra in Shetland, UK. Biological Conservation 49: 241-254.
Lenton, E.J., Chanin, P.R.F., Jeffries, D.J. (1980). Otter survey of England 1977-79. Nature Conservancy Council, London.
Lunnon, R.M., Reynolds, J.D. (1991). Distribution of the otter (Lutra lutra) in Ireland and its value as an indicator of habitat quality. In: Jeffrey D.W., Madden, B. (eds.). Bio-indicators and environmental management, 435-443. London, Academic Press.
MacFadden, Y.M.T., Fairley, J.S. (1984). Food of otters in an Irish limestone river system with special reference to the crayfish. Journal of Life Sciences - Royal Dublin Society 5: 65-76.
Marnell, F. Kingston, N., Looney, D. (2009). Ireland Red List No. 3 - Terrestrial mammals. National Parks & Wildlife Service, Dublin, Ireland.
McGarrigle, M., Lucey, J., O’Cinneide, M. (2010). Water Quality in Ireland 2007-2009. Environmental Protection Agency, Wexford, Ireland.
NPWS (2007). The status of EU protected habitats and species in Ireland. National Parks & Wildlife Service, Dublin, Ireland.
Ó Néill, L. (2008). Population dynamics of the Eurasian otter in Ireland: integrating density and demography into conservation planning. Unpublished PhD Thesis. Trinity College Dublin, Ireland.
Ó Néill, L., Veldhuizen, T., de Jongh, A., Rochford, J. (2009). Ranging behaviour and socio-biology of Eurasian otters (Lutra lutra) on lowland mesotrophic river systems. European Journal of Wildlife Research: 55: 363-370.
OSi (2005). OSi Discovery series vector data. Ordnance Survey Ireland, Dublin, Ireland.
Ottino, P., Giller, P. (2004). Distribution, density, diet and habitat use of the otter in relation to land use in the Araglin valley, Southern Ireland. Biology and Environment, 104B: 1-17.
Prigioni,C., Balestrieri, A., Remonti, L., Sgrosso, S., Priore, G. (2006). How many otters are there in Italy? Hystrix 17: 29-36.
Quaglietta, L., Martins, B.H., de Jongh, A., Mira, A., Boitani, L., (2012). A low-cost GPS GSM/GPRS telemetry system: performance in stationary field tests and preliminary data on wild otters (Lutra lutra). PLoS ONE 7: e29235. doi:10.1371/journal.pone.0029235
Reid, N., Hayden, B., Marnell, F., McDonald, R. (in prep). National Otter survey of Ireland 2010/2011. Irish Wildlife Manuals.
Sidorovich, V.E., Lauzhel, G.O. (1992). Numbers of otters and approach to population estimation in Byelorussia. IUCN Otter Spec. Group Bull. 7: 13-16
Sulkava, R. (2007). Snow tracking: a relevant method for estimating otter Lutra lutra populations. Wildl. Biol. 13: 208-218.
Résumé :Comment Evaluer la Distribution et la Taille de la Population de Loutres? Cas d’Une Etude Irlandaise
Les États membres de l'UE sont tenus de soumettre des rapports à la Commission européenne tous les 6 ans, détaillant l'état de conservation des espèces et des habitats figurant sur la Directive Habitats. La loutre (Lutra lutra) est l’une de ces espèces. Malgré un certain nombre d'enquêtes nationales qui ont montré que la Loutre était très répandue à travers l’Irlande, son statut de conservation en 2007 était considéré comme dans un état défavorable. Alors que la distribution, l'habitat et les possibilités d’expansion étaient considérés comme favorables, la population a été jugée comme menacée. Ce document examine les données recueillies depuis l'évaluation de son statut en 2007 comprenant trois enquêtes nationales ainsi qu’une série d'études de radio-pistage. La distribution a été cartographiée et les calculs basés sur les résultats des enquêtes nationales associée aux données reçues du public. La taille de la population a été estimée en calculant l'étendue des habitats disponibles (rivières, lacs et côtes), divisé par la taille du domaine vital moyen et multiplié par le pourcentage de sites positifs de l'enquête nationale la plus récente. Alors que la répartition de la Loutre n'a pas diminué en Irlande entre les enquêtes de 1980/1981 et 2004/2005, la population aurait chuté de 23,7%. En conséquence, la liste rouge nationale a classé la Loutre comme espèce quasi menacée (Marnell et al., 2009).
Revenez au dessus
Resumen: Como Calcular el Rango y Tamaño Poblacional de la Nutria? El Enfoque Irlandés como Estudio de Caso
Todos los miembros de la UE están obligados a presentar reportes a la Comisión Europea cada 6 años, detallando el estado de conservación de especies y hábitats listados en la “Directiva Hábitats”. La nutria (Lutra lutra) es una de las especies incluidas en esta lista. A pesar de una serie de censos que mostraron que la nutria se distribuye ampliamente por el país, en Irlanda en el año 2007 la evaluación del estado de conservación diagnosticó que la nutria se encuentra en una situación desfavorable. Mientras que las categorías de Rango, Hábitat y Perspectivas hacia el futuro, fueron consideradas favorables, la categoría Población fue considerada desfavorable. El presente trabajo analiza los datos detrás de la evaluación del 2007 en Irlanda, que constó de tres censos nacionales de nutrias y una serie de estudios de telemetría. Se mapeó y calculó el rango basándose en la información combinada de los resultados de censos de ámbitos nacionales con registros enviados por el público. El tamaño de la población fue estimado calculando la extensión de hábitats disponibles (ríos, lagos y costas) y dividiéndolo entre el rango de acción diario típico. Este resultado fue multiplicado por la proporción de lugares con avistamientos confirmados del censo nacional más actual. Mientras que el rango de acción de la nutria en Irlanda no disminuyó entre los censos de 1980/81 y los de 2005/05, la tendencia poblacional fue calculada en -23,7%. Como consecuencia, la especie figura como “Casi amenazada (NT)” en la Lista Roja Nacional de Irlanda (Marnell et al., 2009).
Vuelva a la tapa