 |
Last Update:
Thursday November 22, 2018
|
| [Home] |
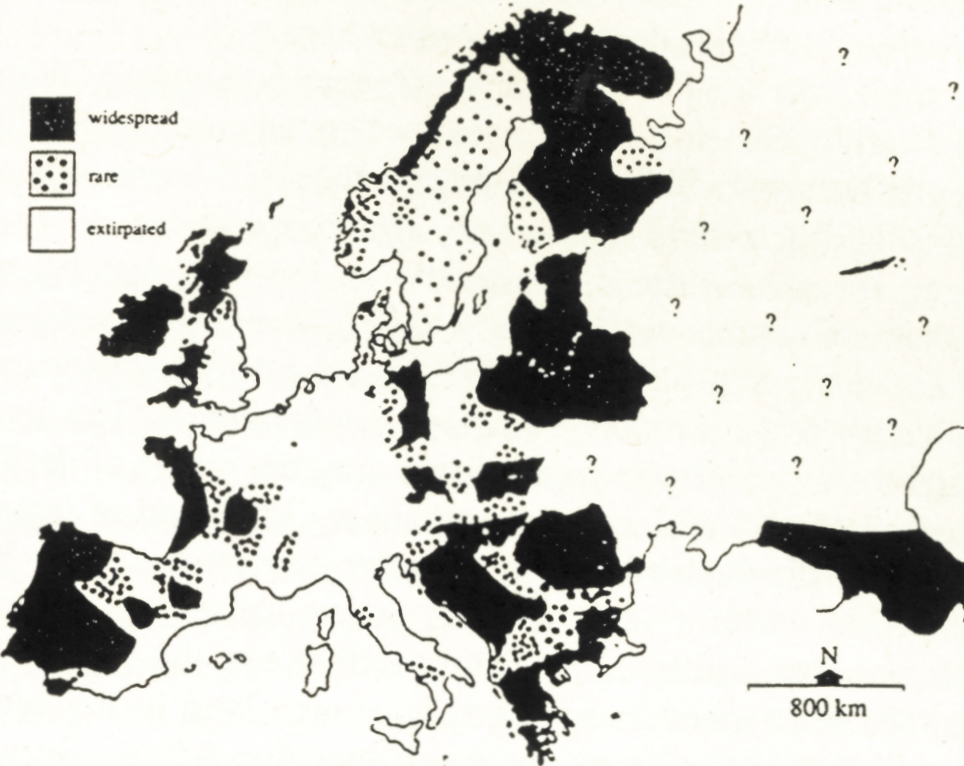
We can begin by looking at the current distribution of otters in Europe (Fig. 1). Populations and range are severely depleted over much of north-west and central Europe. Populations thrive around the western seaboard and in parts of the east.
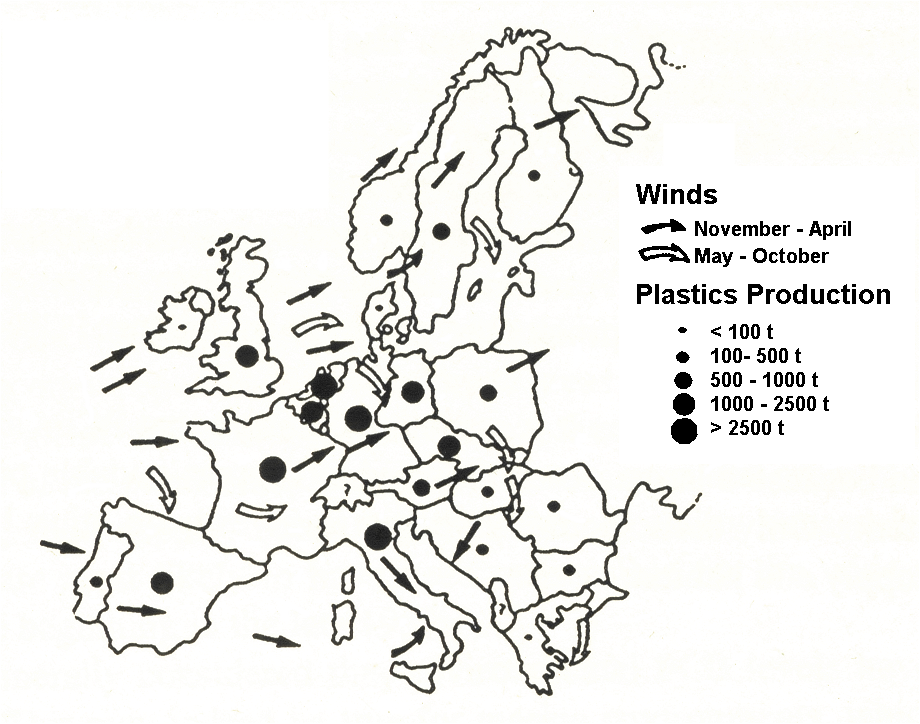
Figure 2 shows an index of industrial output in Europe and the direction of prevailing winds. Otters are extinct or threatened in those countries with high industrial output and in areas downwind of such countries. This suggests that the decline was caused by a contaminant that both entered watercourses locally but was also widely dispersed by wind. Because the decline was rapid and over a large area during the late 1950s and 1960s it indicates a contaminant which reached critical levels during that time. The widespread industrialisation in Britain and in much of western Europe in the 1950s would have led to increased contamination with compounds such as PCBs. Studies of lake sediments and of fish in museums have shown an exponential increase in PCBs during the 1950s and 60s.
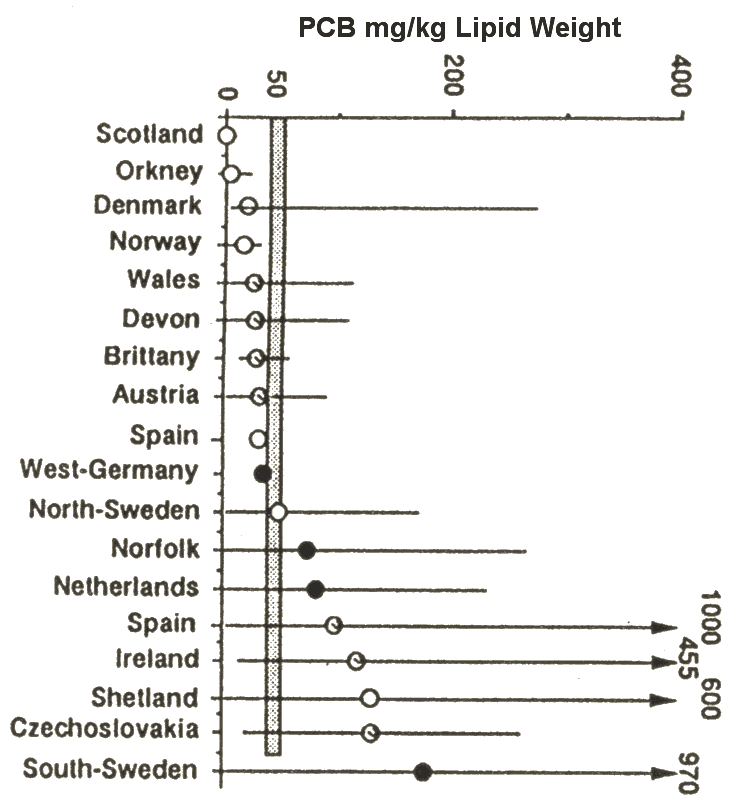
PCBs are known to have a wide range of effects on mammals. They are endocrine disrupters. They can have marked effects on the endocrine system, on reproduction and on the immune system. Figure 3 shows the concentrations of PCBs in otter tissues from various regions of Britain and Europe. The horizontal line at 50 ppm is the tissue concentration associated with reproductive failure in PCB-dosed laboratory mink. It can be used as a rough standard for likely effects on wild otters. In general, in those countries with a mean PCB level much greater than 50 ppm, otter populations have been in decline or are very rare. In those countries where mean levels are below 50 ppm, the otter population is widely distributed or expanding. Figure 3 is based on total PCBs and of course PCBs vary widely in their toxicity. There are differences in the PCB congener patterns from different regions and countries but we have found that 58-78% of the summed PCBs in a sample consist of those which are likely to cause physiological damage (mixed-function oxidase inducers). Dutch studies have found that PCBs 126 and 169, the most toxic congeners, are preferentially accumulated in otters.
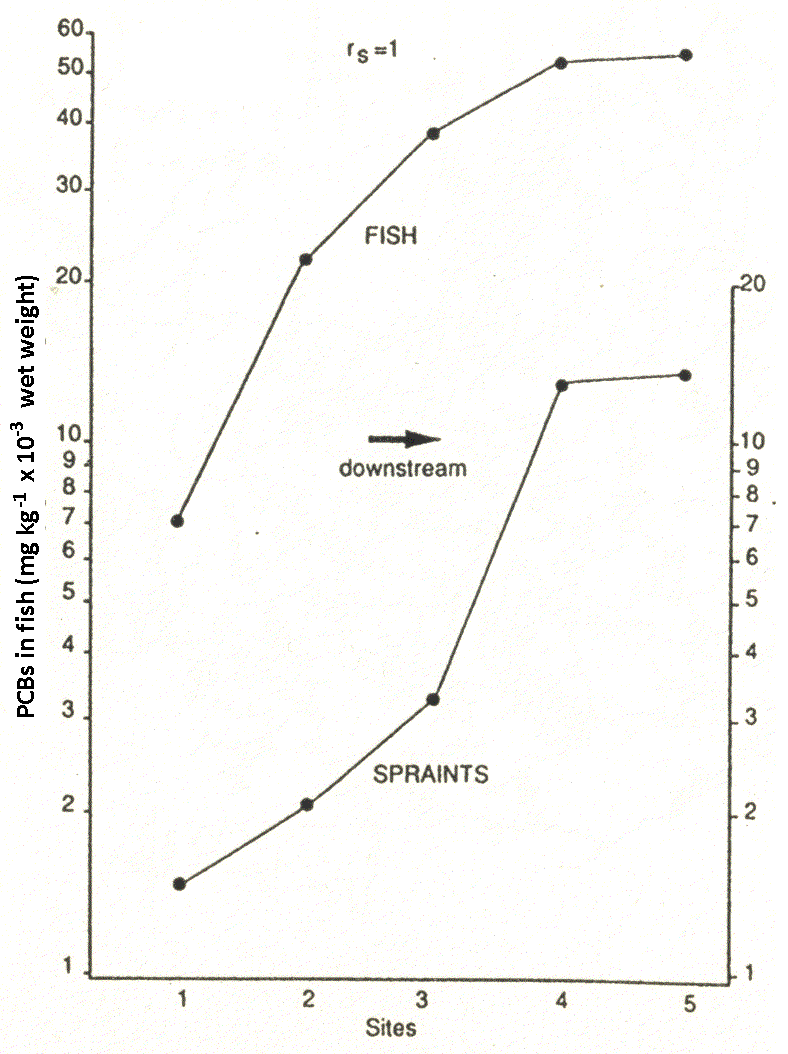
The two otters in our study with the highest PCB levels, from south-east England, showed pathological symptoms similar to those of Baltic seals, which were considered to be suffering from PCB-induced adrenocortical hyperplasia, resulting in reproductive failure and a breakdown in the immune system These symptoms in otters included bleeding feet, deformed toes and claws, uterine tumours and skin lesions. One otter was showing disorientation behaviour prior to death, walking round in circles. A few days earlier it was seen regularly during the day, but in this region otters are nocturnal. Similarly, several of the highly contaminated Irish otters which we analysed showed disorientation behaviour; two of them were found after wandering into shops. Several were blind. Such behaviour patterns are consistent with organochlorine poisoning. Overall, then, evidence in Figure 3 suggests an inverse relationship between mean PCB levels in tissues and the status of an otter population. Otter samples for analysis are obtained infrequently both in space and time and there may be biases in that many may come from thriving populations or alternatively from areas of high human activity. To overcome this we examined PCB levels in spraints, which can be collected systematically. Figure 4 shows data from a river where we have measurements of PCBs in fish tissues and in otter spraints from the same sites. Note the direct relationship.
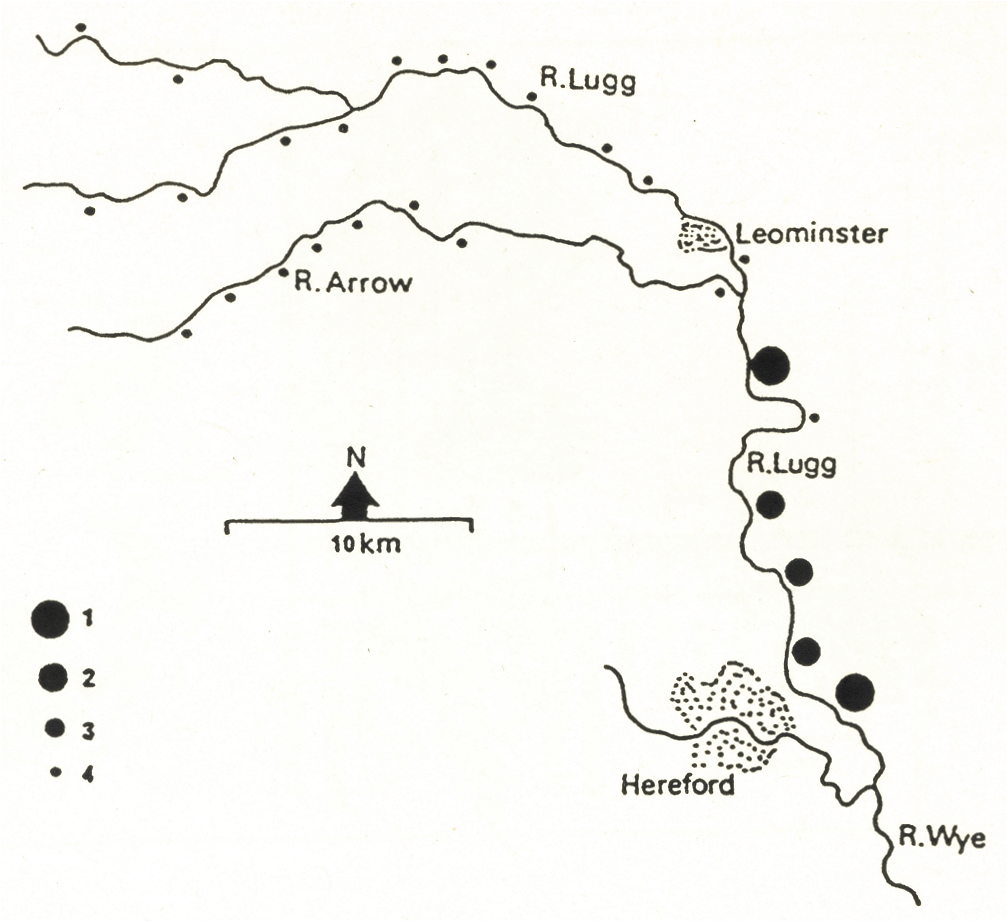
Figure 5 illustrates the concentrations of PCBs in spraints in a catchment in the Welsh borders. The size of the dot indicates the amount of PCB in the sample. Otters in the upper part of the river were thriving and PCBs were low, as they were in a tributary. Note how much higher the levels of PCBs were in the lower part of the river. Otter signs were much scarcer here. However PCB levels dropped sharply in the last year of our study - we believe it may have been due to improved effluent treatment installed in a large dairy. Otter signs are now abundant on the lower part of the river.
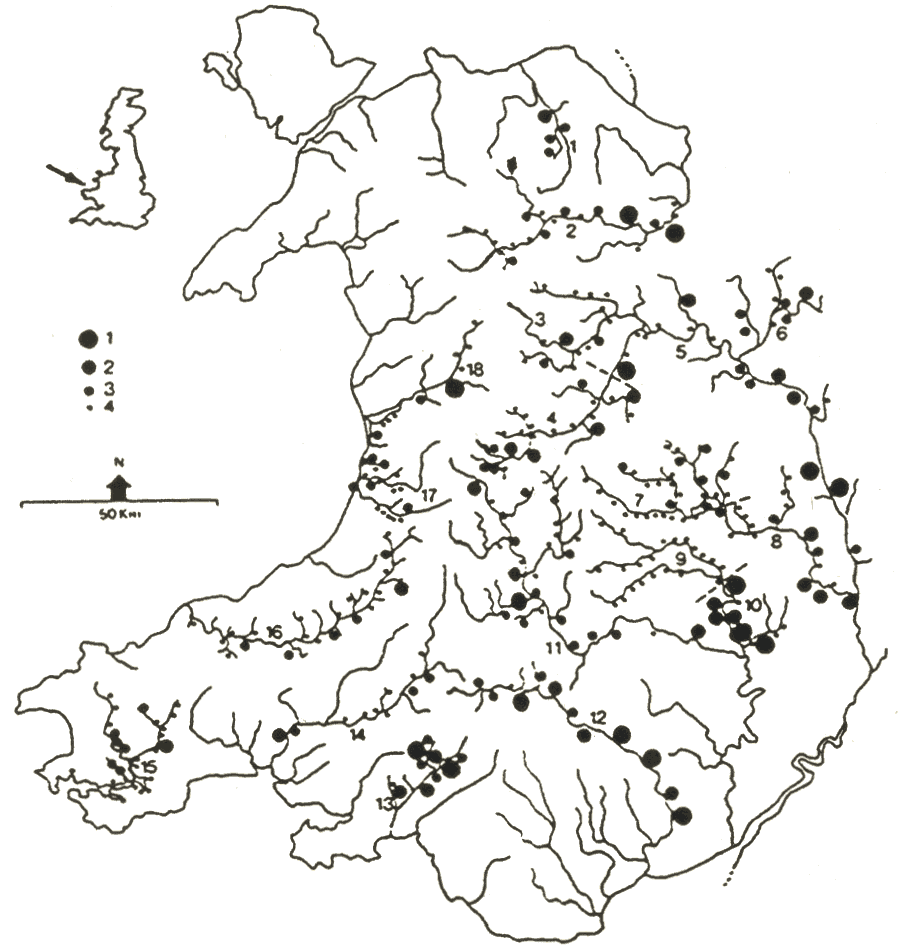
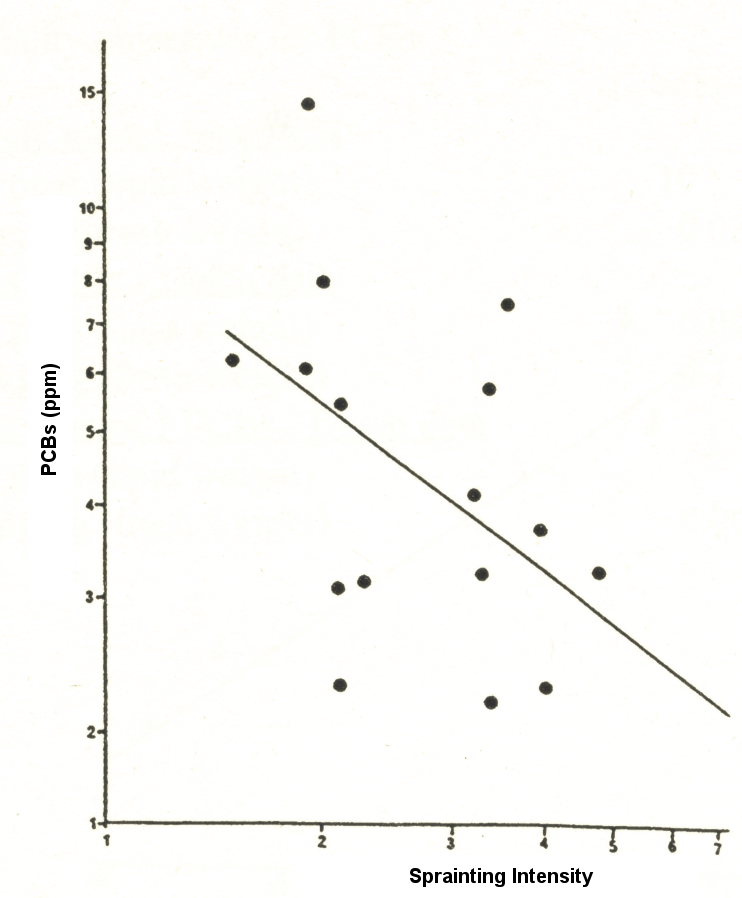
We have also carried out a number of regional surveys of PCBs in otter spraints. Figure 6 shows the results of our study in Wales. There is a general increase in PCBs from west to east (as we have found also in Ireland and western France). The industrial south has been a major source of contamination. There is a significant negative correlation between overall sprainting intensity and the level of PCBs, i.e. the higher the mean PCB level in spraints from a catchment, the lower the mean number of spraints per sprainting site (Fig. 7).
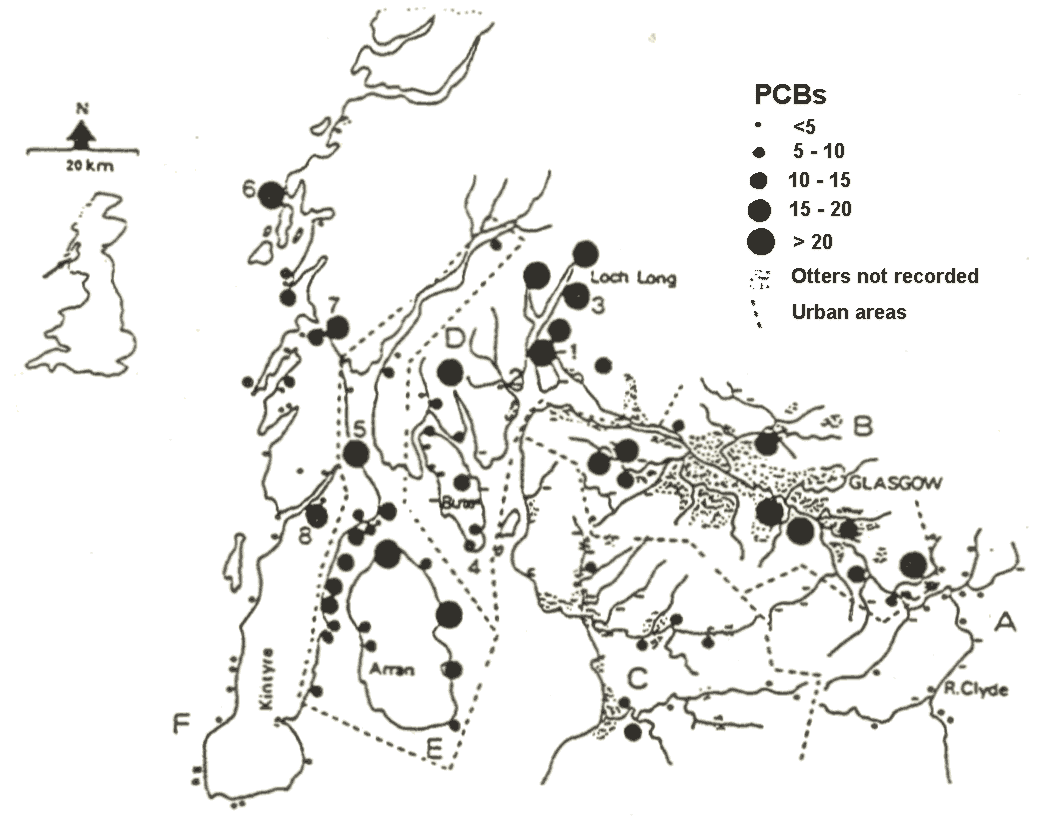
The River Clyde in Scotland (Fig. 8) rises in unpopulated uplands and flows down through increasingly industrialised towns into the city of Glasgow. Immediately we reach urbanised areas, there is a marked increase in PCB loads in spraints. In the Clyde estuary, we found high levels around nuclear submarine bases, there are elevated levels related to sewage sludge dumping and currents disperse the contaminants away from the dumping site. There are also hot-spots related to ferry terminals and areas of high boat activity. A recent study of PCBs in the livers of fish from the north of the Clyde estuary, where we found only a few but highly contaminated spraints, has demonstrated PCB levels similar to those in the Baltic and Wadden Seas. We believe that the inner Clyde estuary is probably too polluted to support a long-term viable otter population. However, because most of the surrounding area has very low levels of pollution and thriving otter populations, there will be regular immigration into the estuary.
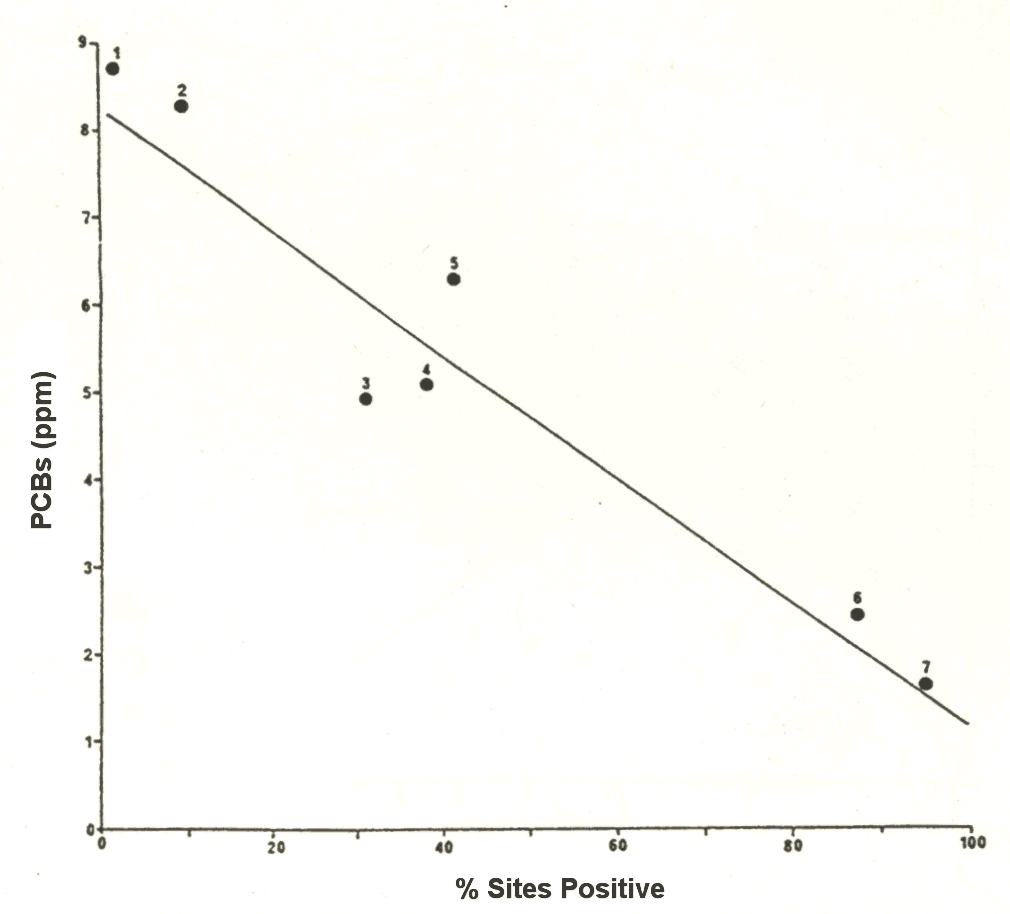
On a regional scale we can look at the relationship between mean PCB concentration in spraints and the percentage of positive sites for otters taken from the national surveys (Fig. 9). In areas with few signs of otters there are high mean PCB levels. PCB levels are low in regions where otters are widespread.
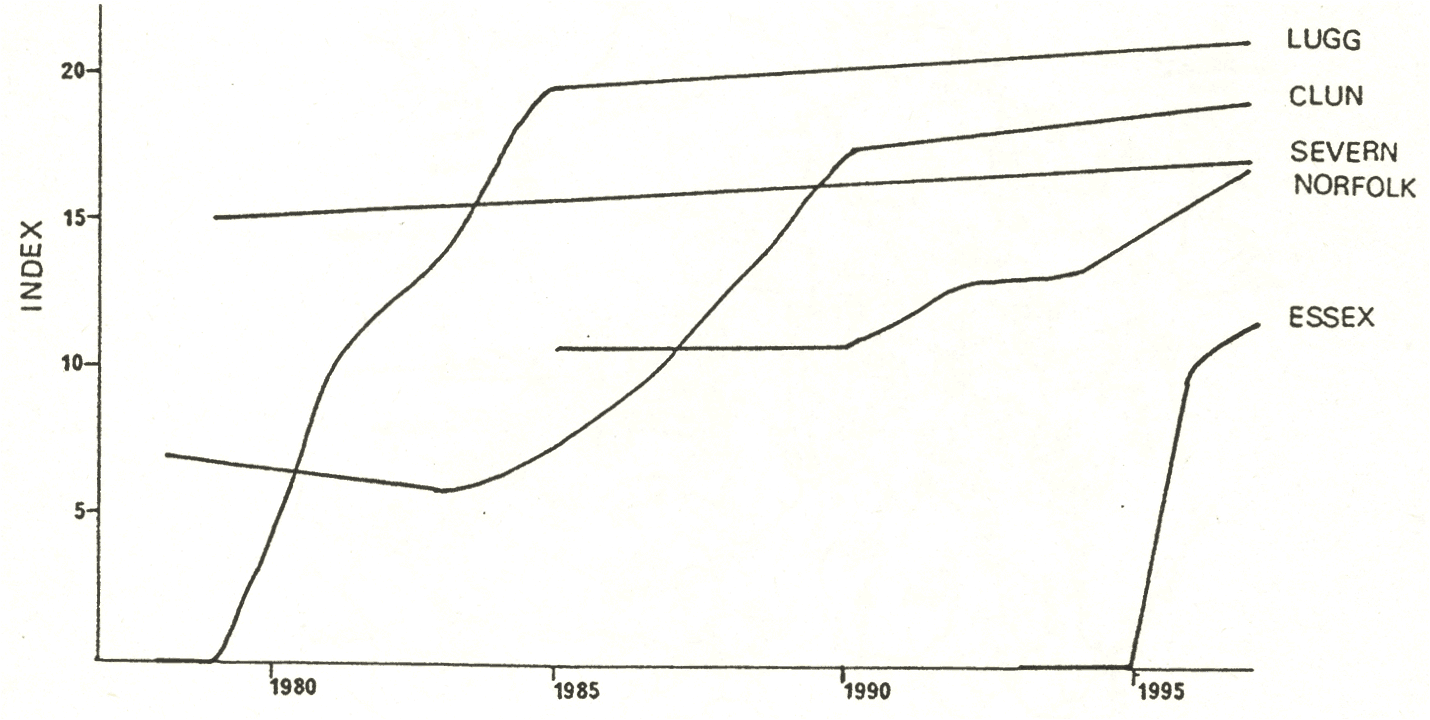
As with the data on PCBs in otters, the spraint data also show good correlative evidence for a PCB effect on populations. There are, however, anomalies that must be addressed. In particular, high mean levels of PCBs have been found in otters in Shetland, where a thriving population exists. This led Hans Kruuk to conclude that toxicity of PCBs to otters is nowhere near as high as for mink, which are known, through experiments, to be sensitive. Hans Kruuk states that “one should not indulge in the common practice of using the effects on one species as a yardstick for another”. Though caution is certainly necessary, for very obvious reasons this has to be common practice in medical and veterinary toxicology. But otters are as sensitive to PCBs as mink. Dutch workers have shown a strong negative relationship between vitamin A levels in liver expressed as dioxin equivalents and PCB concentrations. Similarly, incidence of disease in Danish otters increases with PCB burden. The concentrations at which effects can be measured are similar to effects levels in mink. These data provide strong support for the role of PCBs in the decline of the otter. The question we need to ask is why the Shetland data seem so different in an environment which is said to be pristine. I would suggest that this is because of Shetland’s oil industry and its infrastructure. PCB contamination may be very localised, producing hot-spots of PCB contamination. These are also the areas with the highest human activity, resulting in both greater mortality, e.g. due to traffic and a higher probability of finding dead otters. The situation may be very similar to the Clyde, described above. Most of Shetland is unaffected by this pollution, allowing thriving otter populations to recolonize areas of high contamination. Almost all of the information we have then points to a central role of PCBs in the decline of the otter. This does not of course mean that other factors are not important - habitat, food supply, other contaminants, mortality caused by man’s activities. But PCBs are most likely to have been responsible for the wide-scale and synchronised decline beginning in the late 1950s. It is generally considered that environmental PCB levels have not yet reached their peak. This may indeed be true for marine environments, which are the eventual sink for PCBs. But we have evidence that they are declining in otters and such declines have been reported by other workers in the terrestrial environment. In the sample of Danish otters we analysed, there was an overall annual decline of 7% per year between 1980 and 1990, and in our samples of otters from England and Wales, collected between 1984 and 1992, the decline was 8% per year. There was no such trend with DDT, while levels of Dieldrin, considered by some UK workers to be the main cause of the decline, have been low since these analyses first began. During the 1980s there was a slow expansion of otters in England, Wales, and in Denmark. Since the early 1990s this increase has accelerated considerably in Britain - I believe it has also in Denmark. This would indicate that PCB levels have now fallen below that critical level which could significantly affect populations. Figure 10 illustrates, for several rivers, changes in an index of population of otters with time. The index is a combination of the % of positive sites in a survey and the mean number of spraints per positive site. We cannot relate this index directly to numbers of otters but we do believe it represents population trends. The upper Severn, in mid-Wales retained a thriving otter population during the period of decline and the index has remained relatively constant, with perhaps a slight trend of increase in this decade. Further east, on the Welsh borders, the otter population on the River Lugg disappeared in the late 1970s. Note how the index shows an almost classical population growth curve to equilibrium. Slightly further east the Clun shows a later but similar trend. The same trend is apparent, but much later in the West Norfolk catchments in eastern England, where the native population fell to a very low level, isolated from the western strong-holds, but where it has been reinforced by restocking since 1983. Colonisation of north Essex catchments, from which otters disappeared 35 - 40 years ago, began in 1996 and appears to be proceeding apace.
Can we derive environmental standards to protect otters? We have developed some preliminary standards for total PCBs based on the mink model. We are adopting a precautionary approach to protect otter populations. The Dutch have proposed quality objectives based on the dose-effect relationship between PCBs and liver vitamin A deficiency using dioxin-toxic equivalents (TEQs) and on the sums of 7 indicator PCB congeners (Table 1). The Dutch quality objectives are rather more stringent than those that we have derived. The TEQs levels are in good agreement with dietary effects levels from recent mink studies in the American Great Lakes area. They are much more stringent than most guidelines to protect the environment against PCBs because of the now known sensitivity of otters. Before a re-introduction study is planned it is essential to ensure that PCBs are at safe levels over a wide area because a large area is required to support a viable population of otters in the long-term. Only then should we begin to investigate other important factors such as food supply and habitat. |
| [Copyright © 2006 - 2050 IUCN/SSC OSG] | [Home] | [Contact Us] |